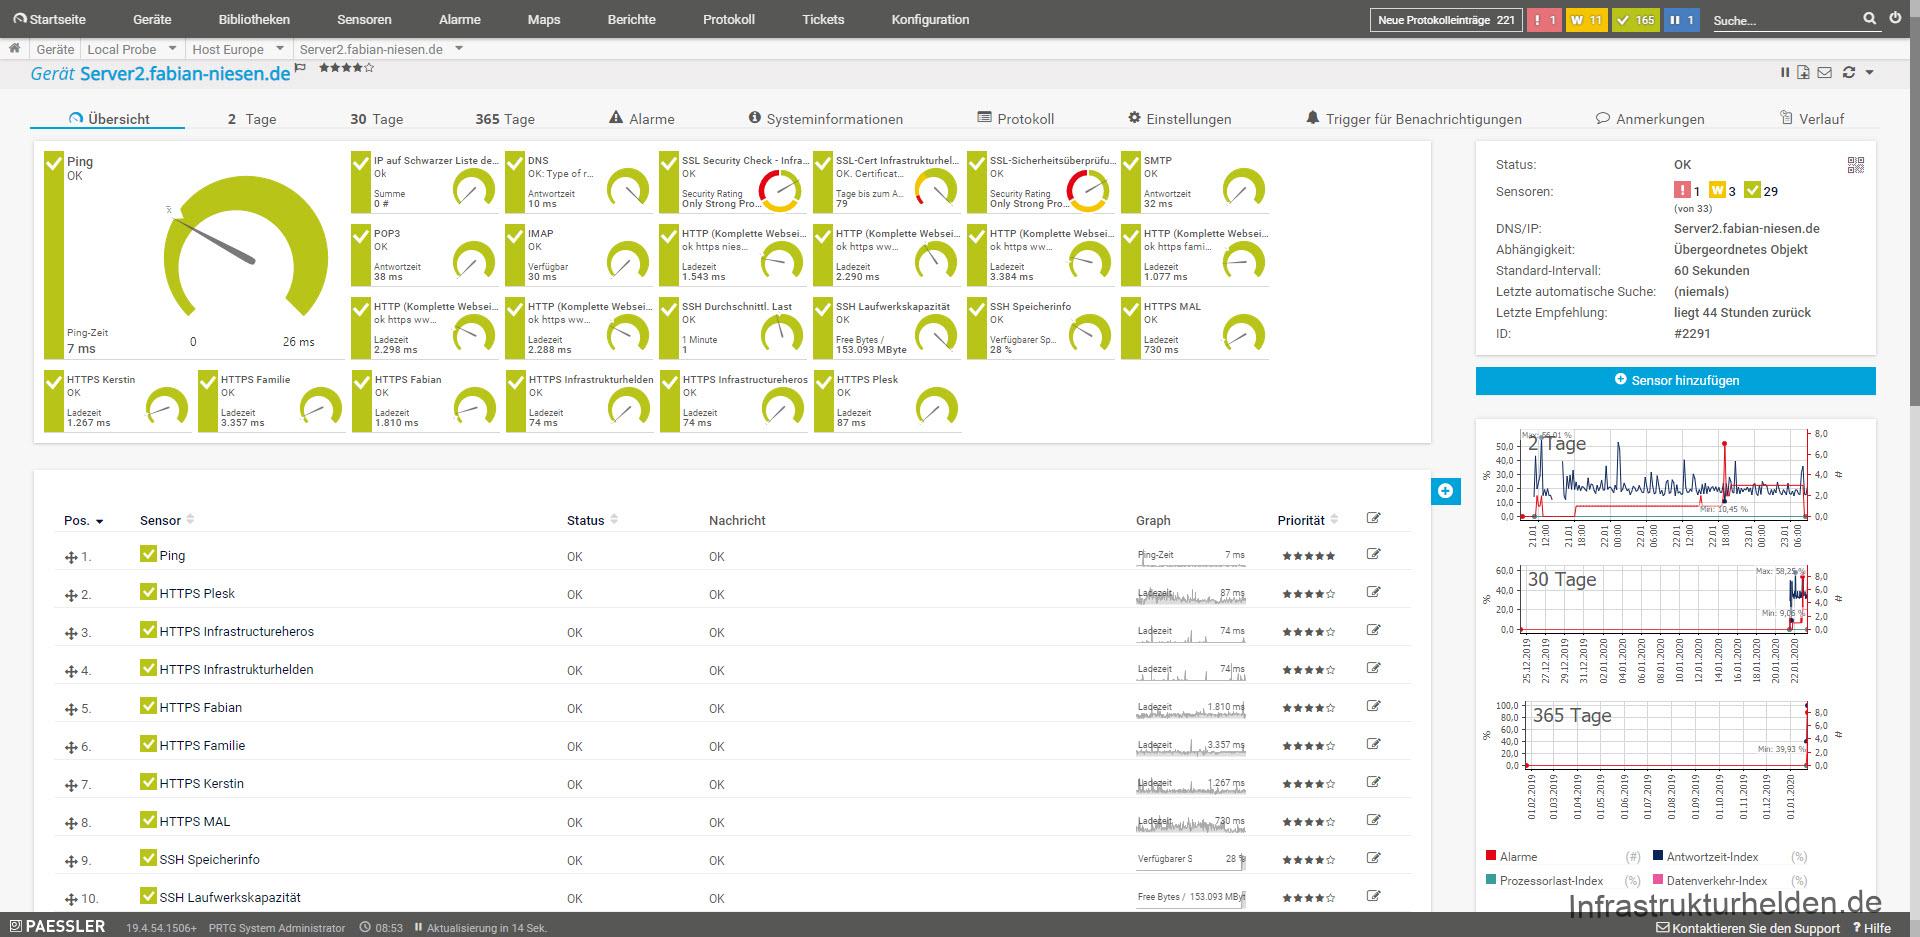
This time an article slightly outside the Microsoft world. This time there is an excursion into monitoring and the monitoring of web servers under Linux. Some know this, nothing is worse than when the website you want to visit is not reachable. Since this happened to me 2 times in 2 days, the web server has hung up and I could not find the error, something had to be done.
So, I remembered PRTG. The nice thing is, the freeware is capable of 100 sensors, enough for a few websites. The additional sensors I can use for my environment at home, there is more than enough that can be monitored.
Installing PRTG
Since PRTG is based on Windows the installation is very easy. The whole thing is self-explanatory. PRTG comes with its own web server that can also be switched to SSL.
For installation there are how-to’s and videos from PRTG manufacturer Paessler on the site. There is also a comprehensive how-to on how to monitor large web server environments and down to what depth. But this is a bit exaggerated to see if you can read this article. Nevertheless I would not like to withhold the link from you.
Setting up PRTG
I have switched PRTG to HTTPS at my place. The important thing for using the PRTG Certificate Importer with the installed computer certificates is that the private key is exportable. If this is not possible or you don’t have the private key in a file, you have to use another certificate. I internally use web server certificates which I issue with my Active Directory certificate authority.
Since PRTG is supposed to monitor everything, a suitable server must be selected. Personally, I would set up my own server, because depending on which sensors you use, the system can get quite busy. A small virtual machine is usually enough for our use case.
Once you have entered the appropriate credentials, PRTG will first see what it finds on the network and set everything up. Since a new installation starts with a 30 day trial version, the number of the sensors is not a problem. Important, he can set up a lot of sensors by default, so a 24 port switch can have over 70 sensors. Or about 100 with a Hyper-V server. So it is recommended to clean up the systems and sensors after the automatic detection. For example, I don’t need every Windows 10 Test VM in the monitoring, the 15 devices with over 10 sensors, which I can save. Also I don’t want to monitor IO performance on my SSD, I don’t need that for me. The most necessary in my environment are currently 173 sensors. I have to clean up a bit in 28 days.

Since the licensing is based on the number of sensors, you have to consider how exactly you want it. If you want to take a look at PRTG, feel free to use the links in this article. I will then get a small payment on a purchase that helps me to run this site.
Sensors for web servers
There are different types of sensors, an important distinction is the authentication and the connection type.
HTTP Sensors
There are different types of HTTP sensors. These work without authentication, for password protected websites the access data must be integrated into the URL or a sensor with suitable support must be selected.
From my point of view the most interesting sensors for web servers are
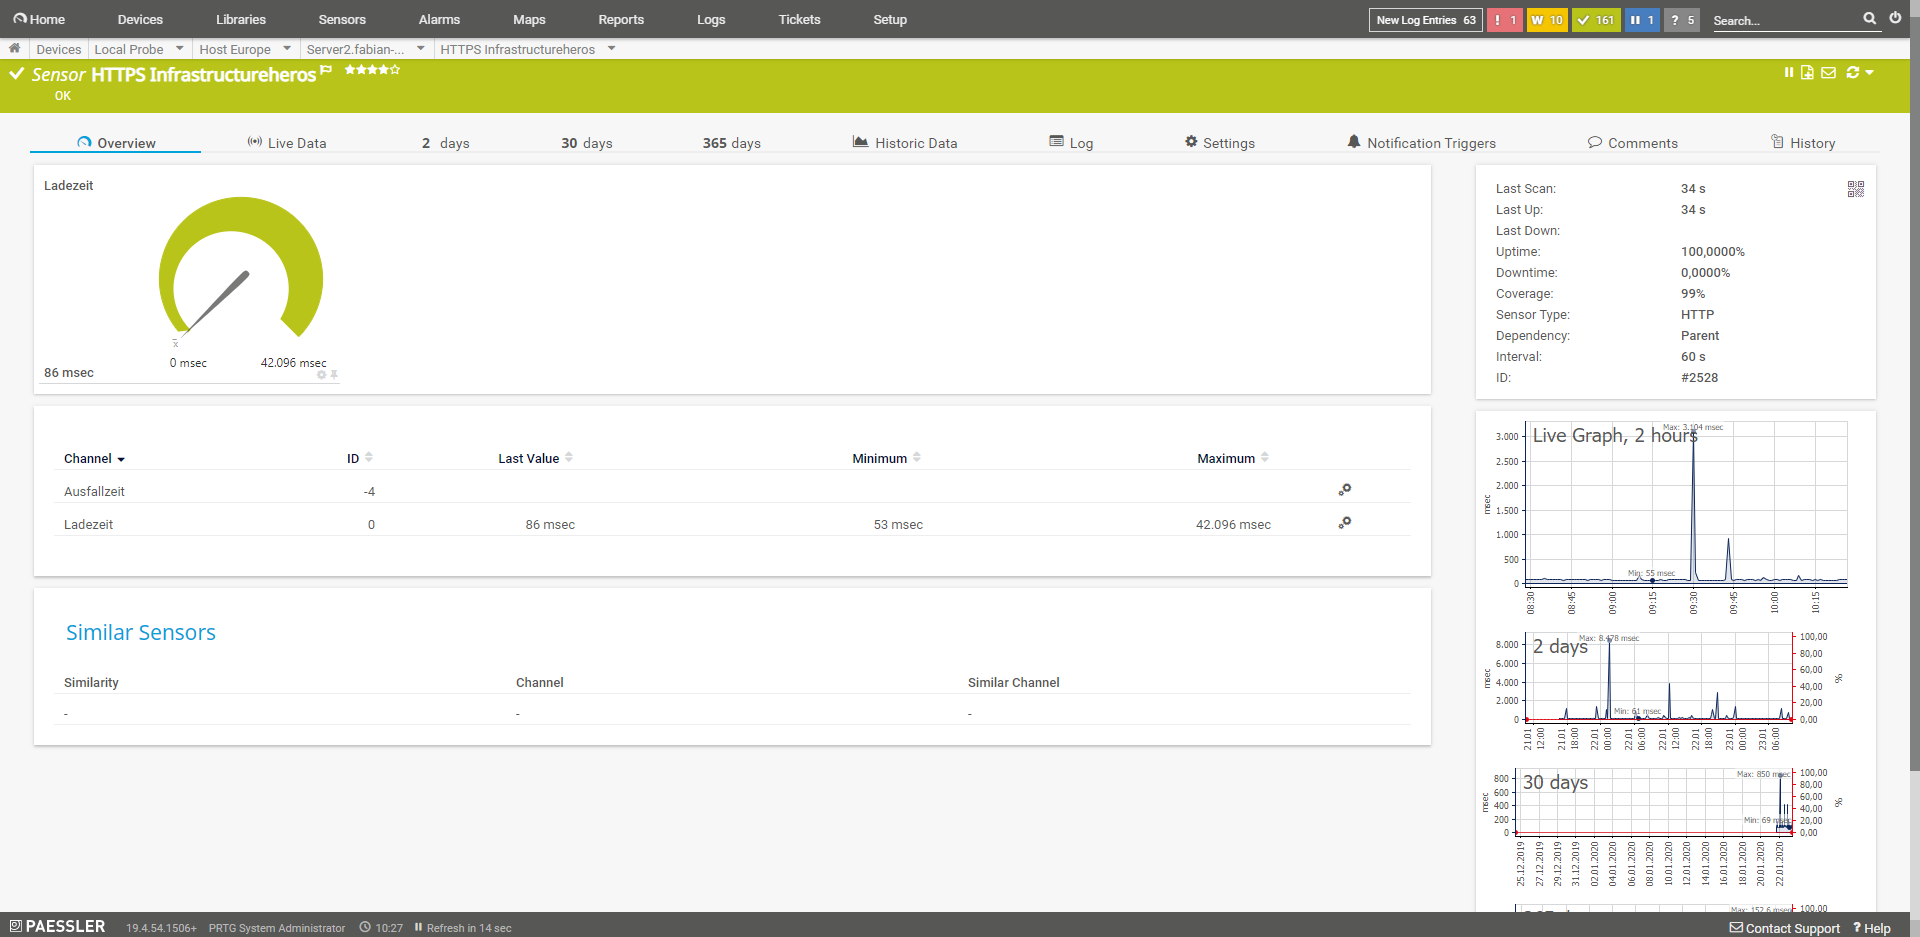
HTTP
Simple sensor that sends a single GET, POST or HEAD request to a URL. This is sufficient to see if the web server responds. It also saves resources so that this test can be run more often without stressing the PRTG server or the web server.
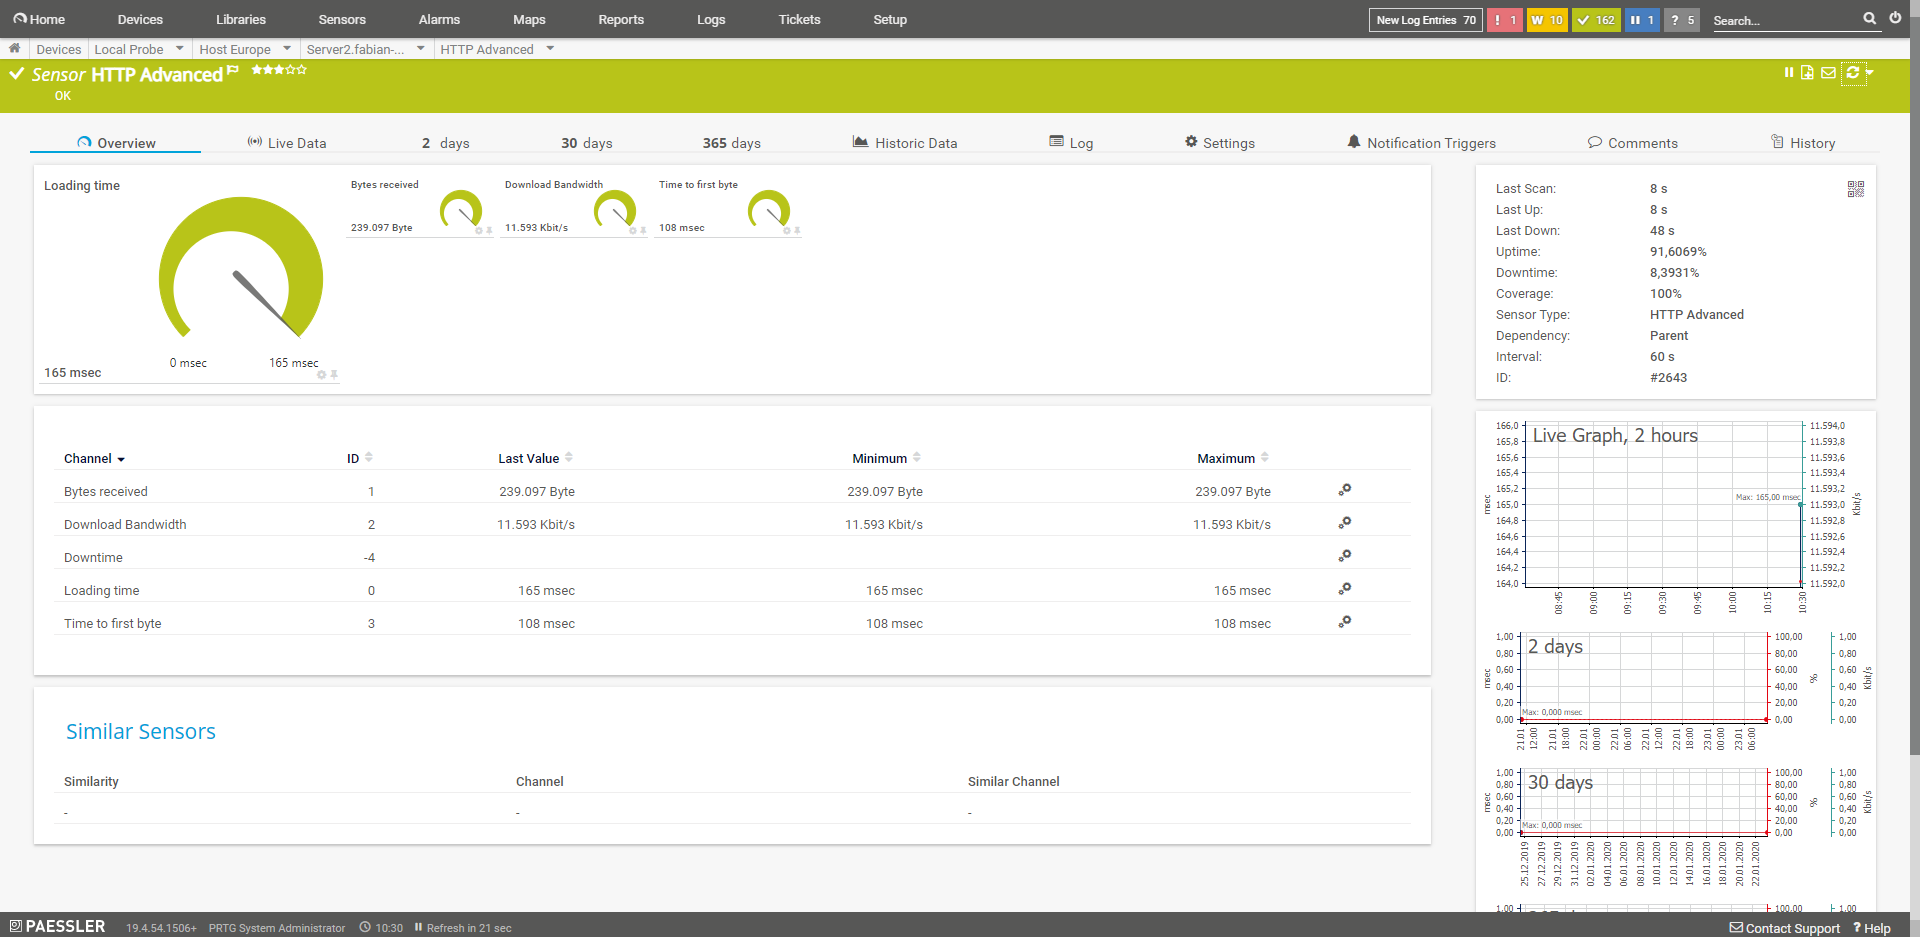
HTTP (Advanced)
This advanced sensor supports authentication, among other things. In addition, the user can also specify his own header, select the user agent or alert in case of content changes. The own header can help if you would like to have the accesses of the monitoring not included in the statistics.
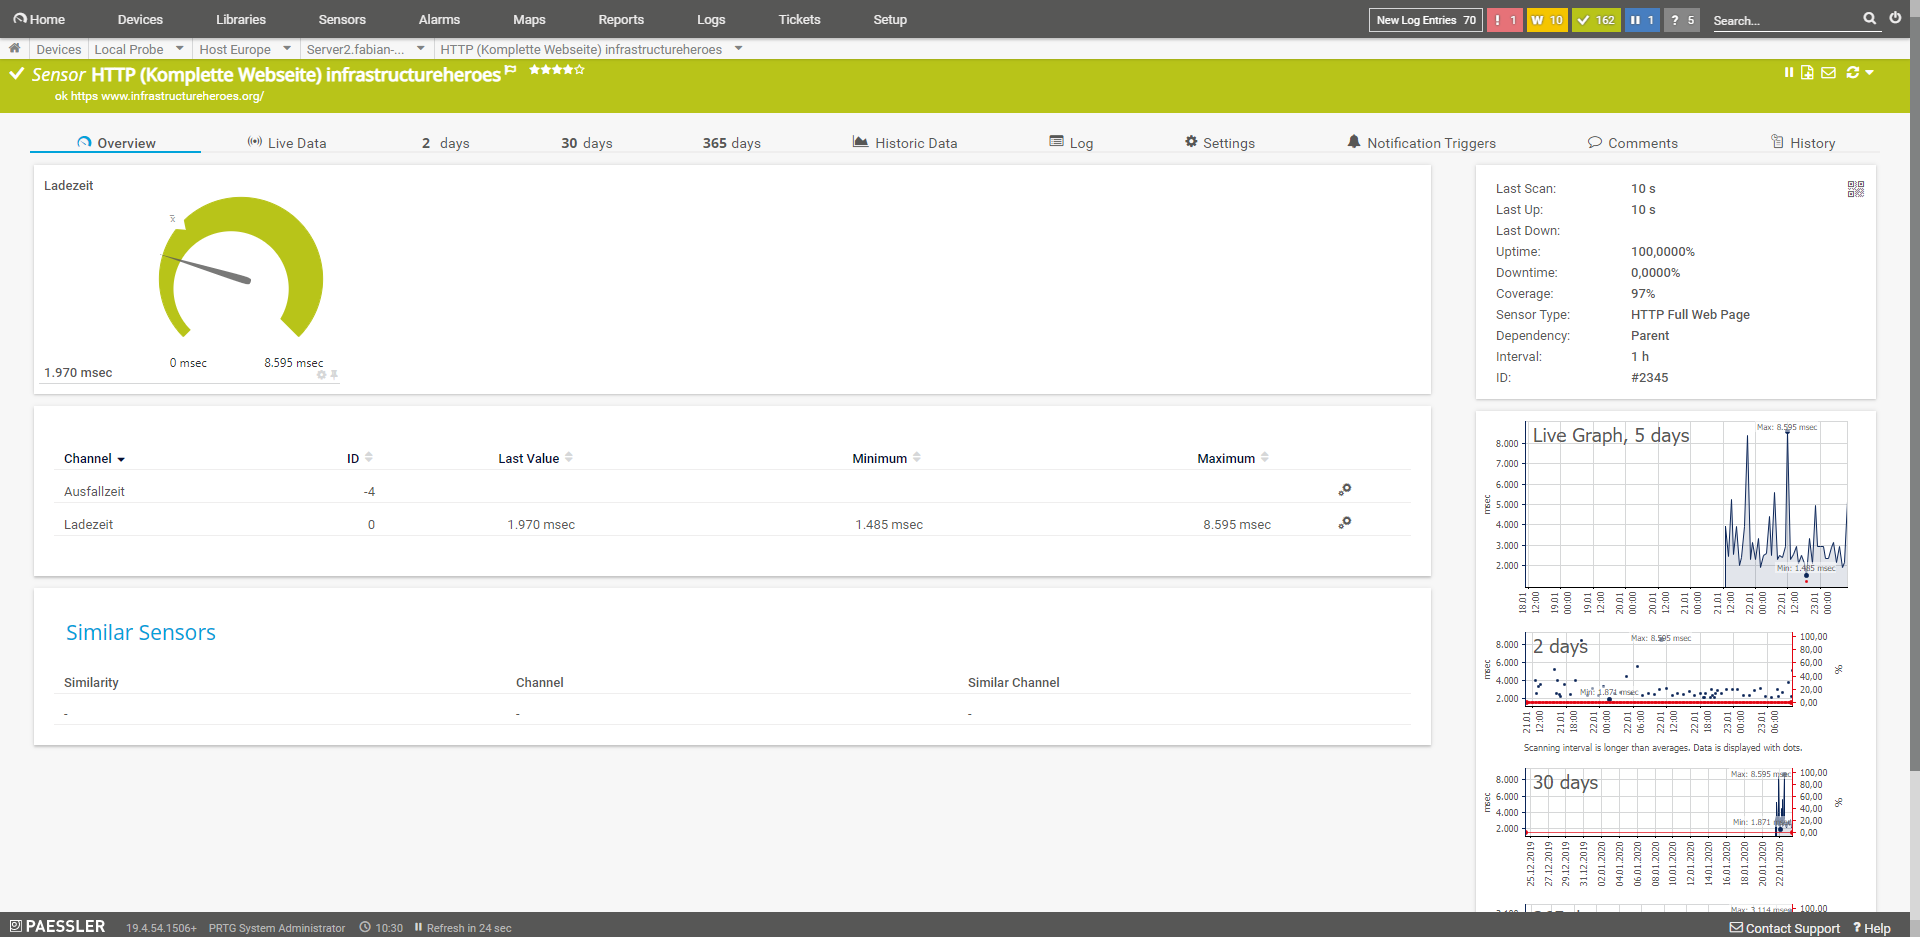
HTTP (Complete Web Page)
From a performance point of view, the most important sensor for me is the one that monitors the complete loading time. However, as this sensor causes considerably more load, it should not run with the default value of 60 seconds. Personally, I set it to 60 minutes on my blogs, I’m more interested in sneaky changes or problems after software updates. I combine this sensor with a normal HTTP sensor that checks the availability of the service. The browsers that the sensor can use are Chromium, PhantomJS or the Internet Explorer. All three offer different options and do not work. So this is a bit of a test.
HTTP (content)
This sensor returns a numeric value from HTTP request. Example, a software returns its status on an HTML request as “[37]”, then the sensor returns the value 37.
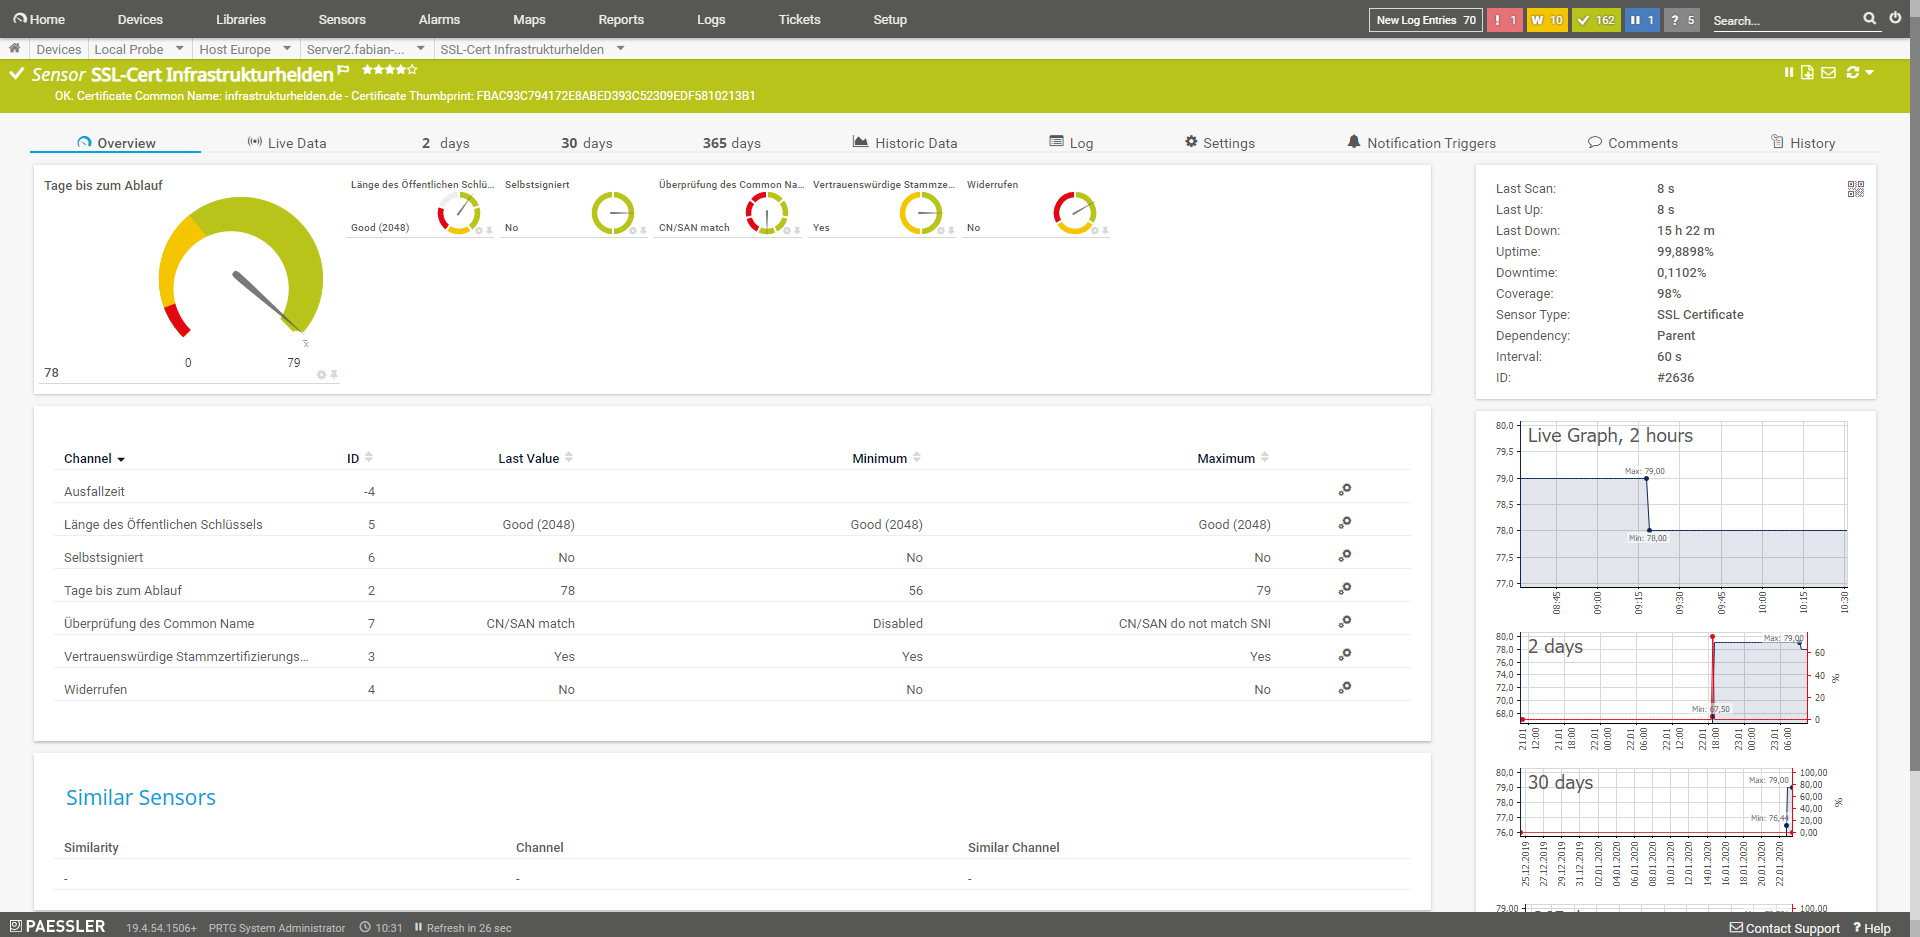
SSL Certificate
Checks the certificate of a connection. So you can monitor that a valid certificate is used.
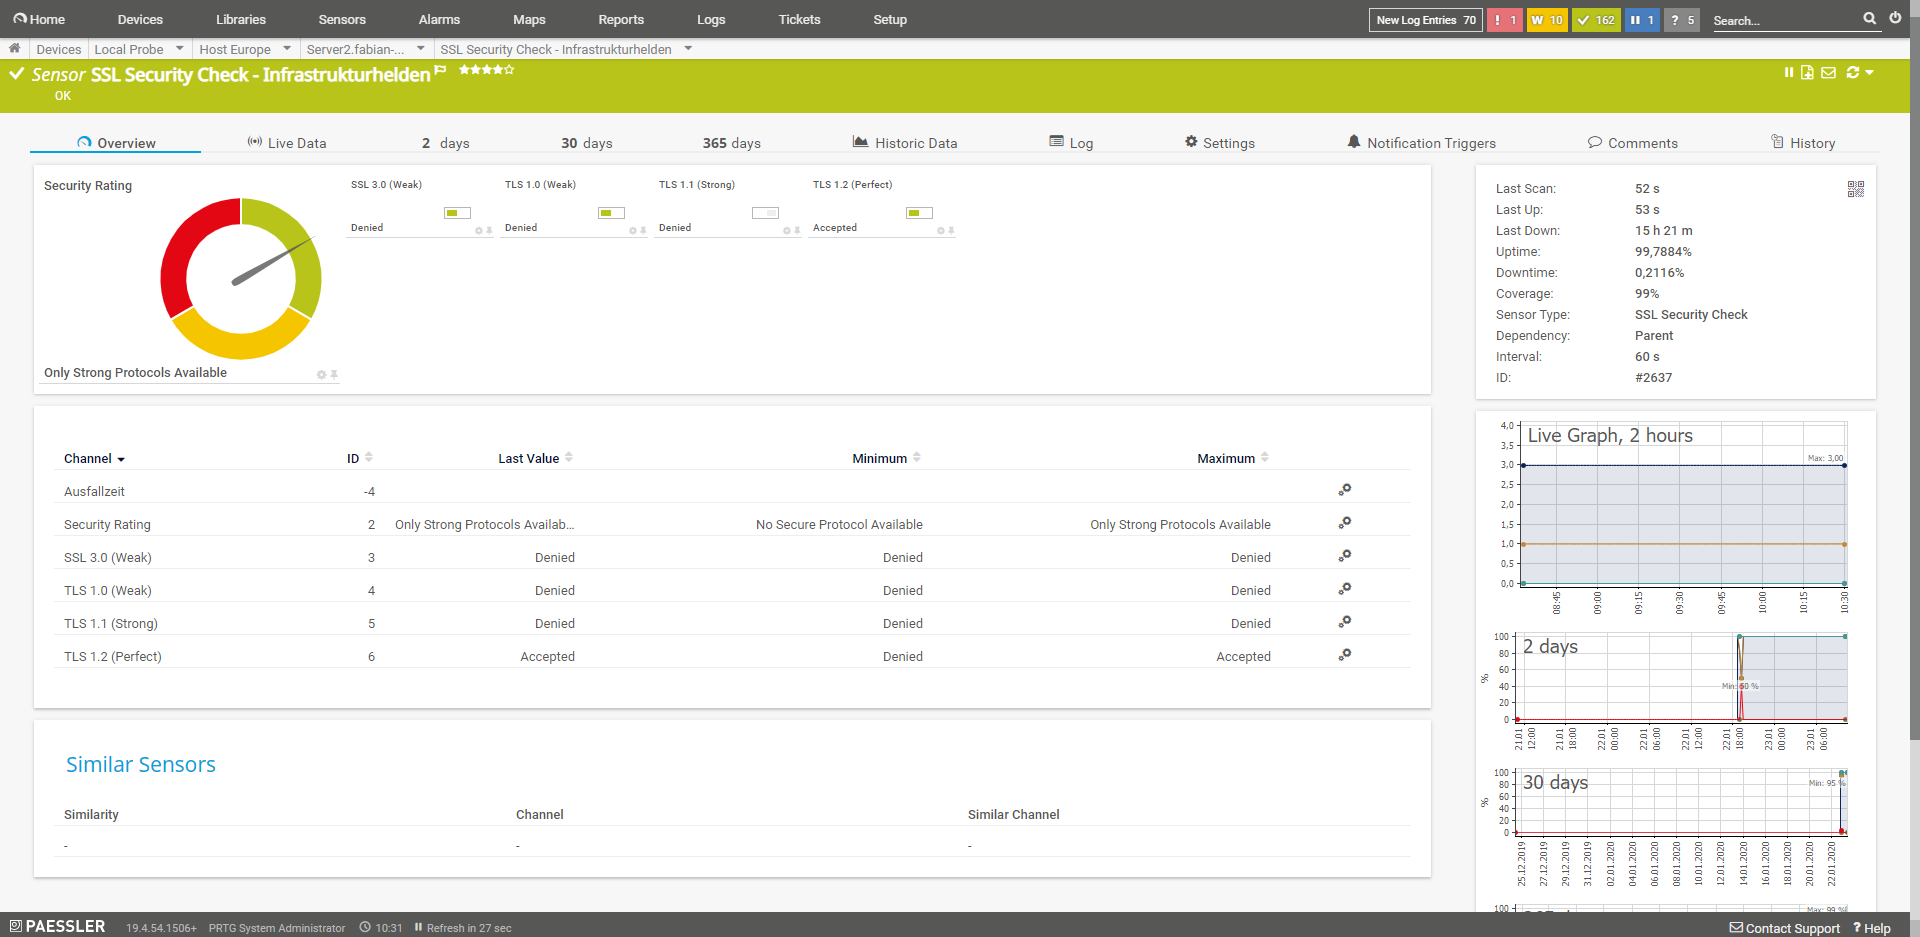
SSL Security Check
This sensor checks the security of the SSL connection. Among other things, tests are performed here for SSL3.0, TSL 1.0, TLS1.1 and TLS 1.2.
SSH Sensors
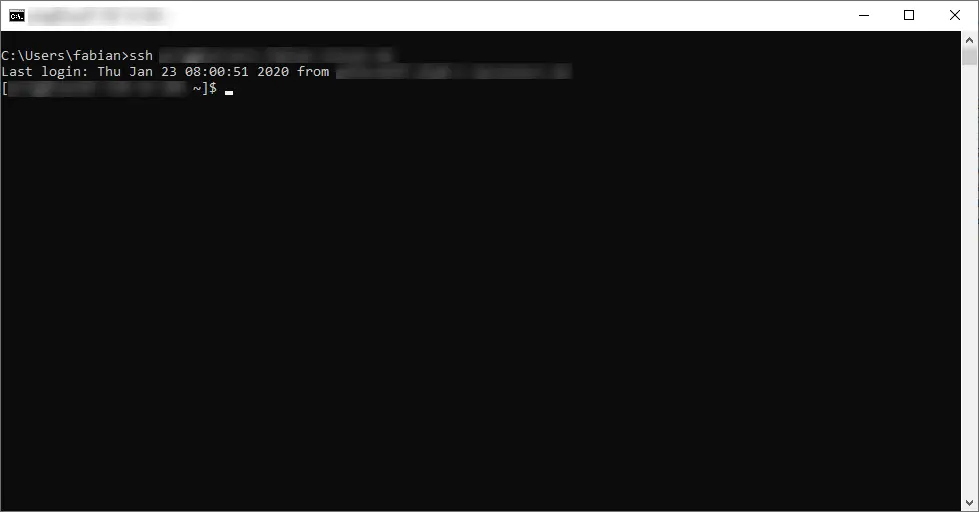
SSH sensors require authentication. This can work with username and password or with SSH keys. If you want to test this with the SSH, you can use Putty. Alternatively, the SSH client can be used with Windows 10.
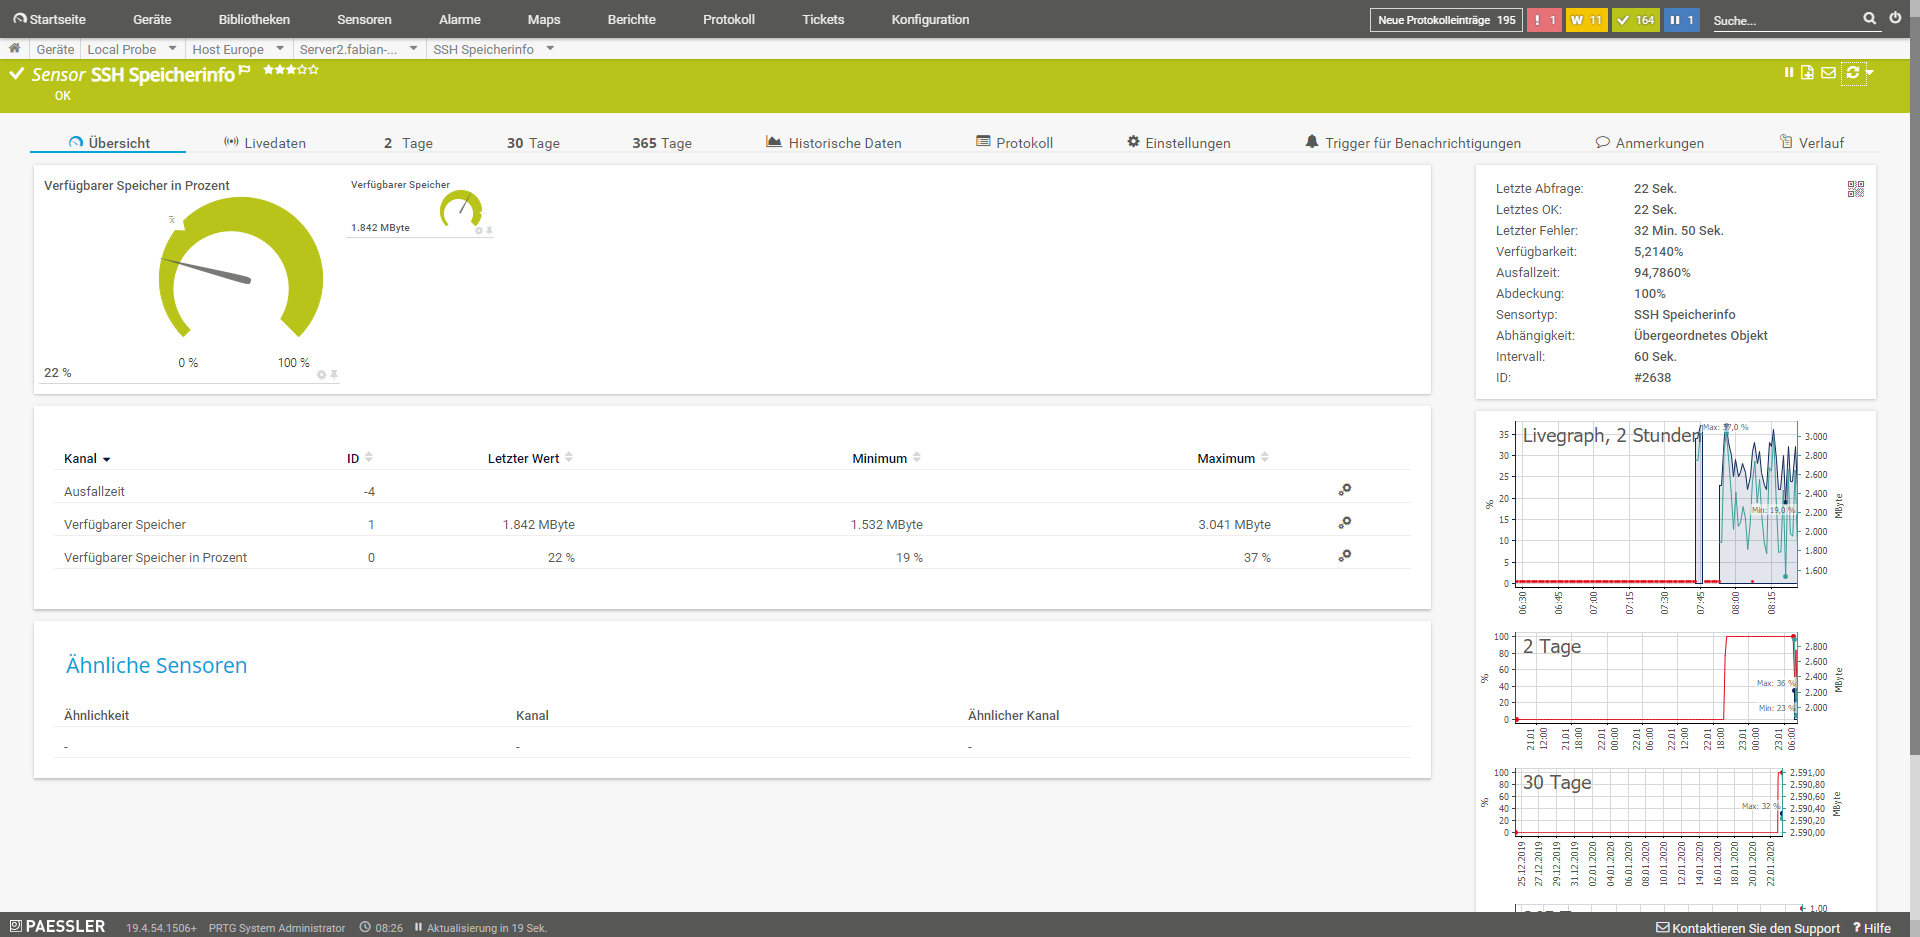
SSH memory info
This sensor monitors the memory consumption of a system.
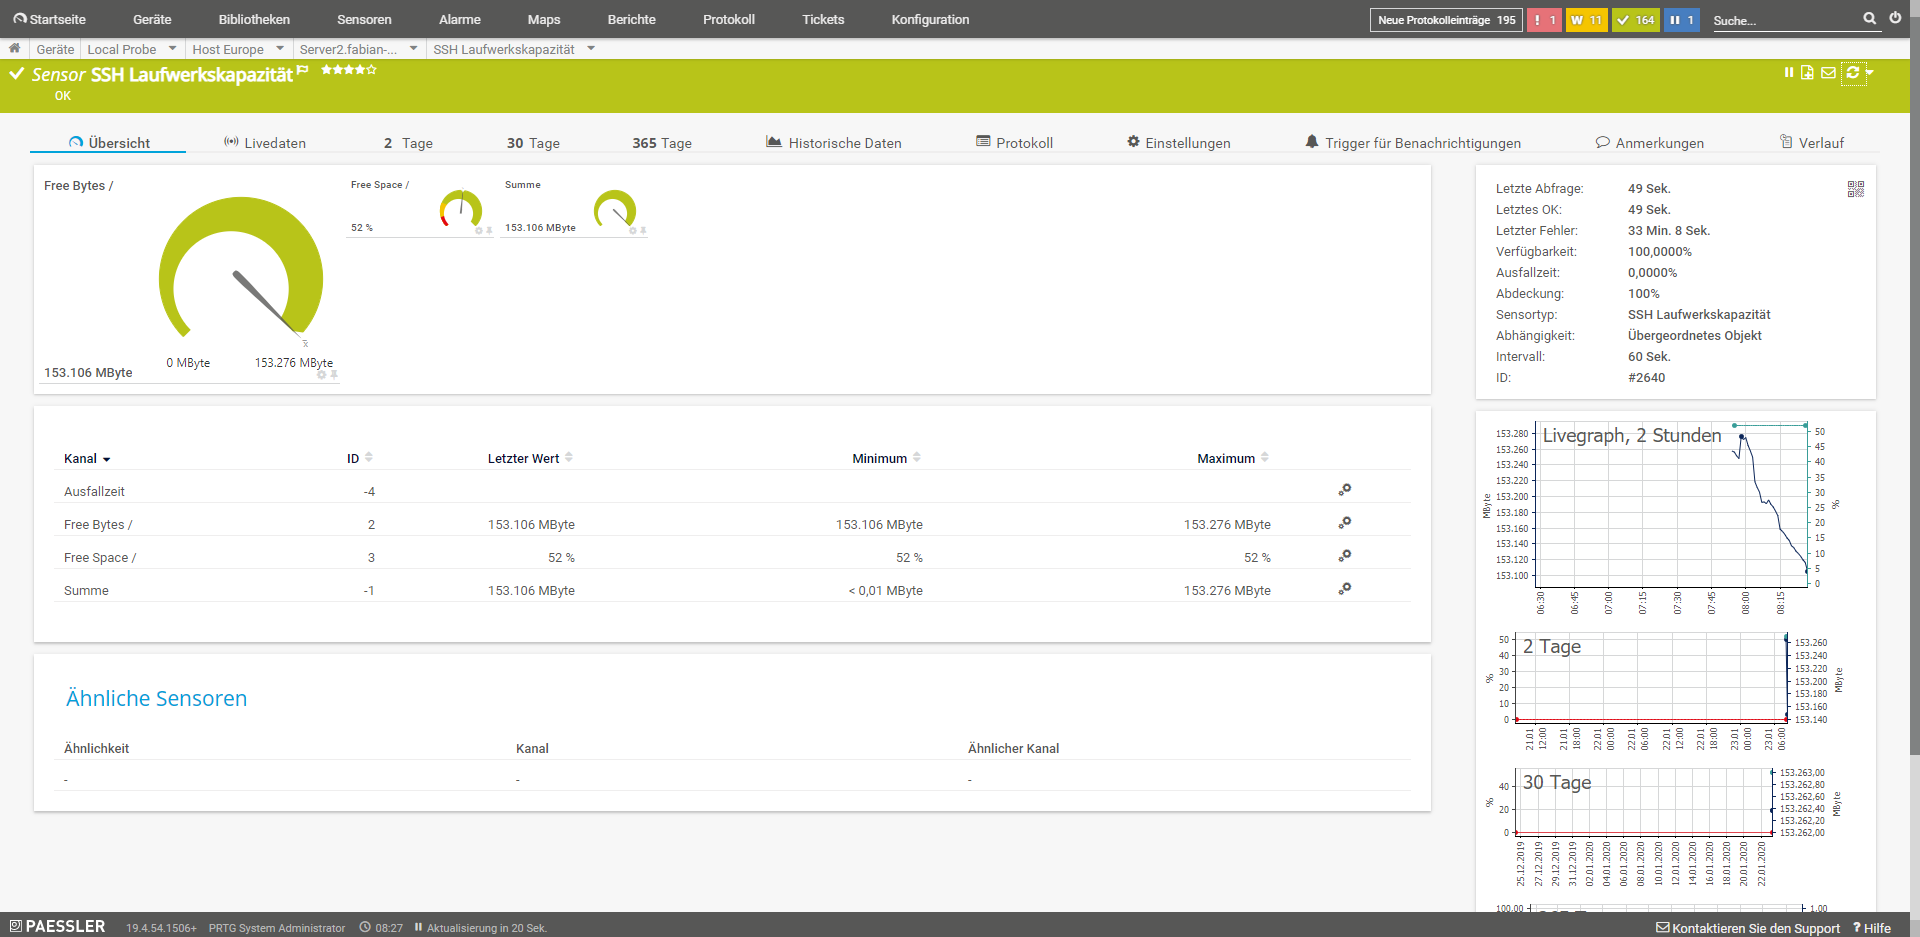
SSH drive capacity
This sensor monitors the drive capacity of individual and selected mount points.
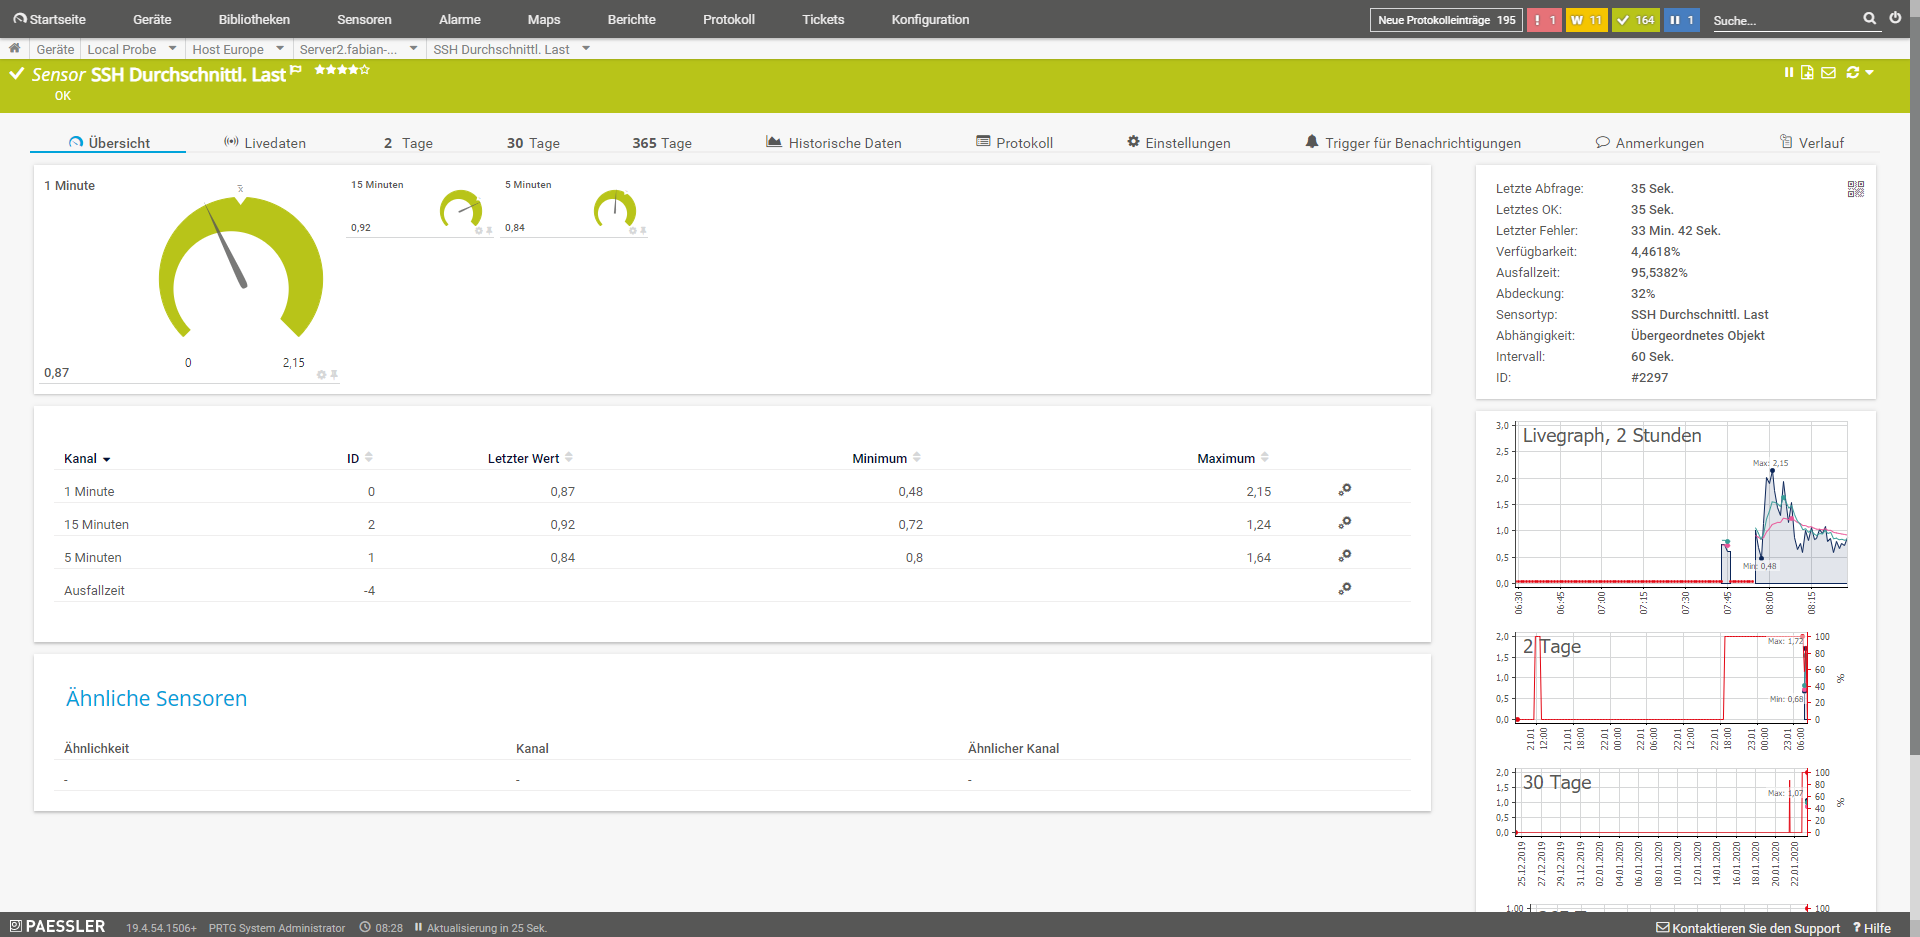
SSH Average load
This sensor monitors the average load on the system.
SSH Script and SSH Script (Advanced)
These sensors run a script on the system via SSH. The script that is executed must return a numeric value or, in the case of the extended sensor, an XML or JSON result. In principle, almost everything can be read out.
Other useful sensors
If the server is not a pure web server as so often, but also mail, DNS and database server, there are a few more sensors that might be useful. For example:
- IMAP: Monitors an IMAP mail server
- POP3: Monitors a POP3 mail server
- SMTP: Monitors an SMTP mail server
- SMTP&IMAP transmission: This sensor monitors the round trip, i.e. sending via SMTP and receiving via IMAP
- SMTP&POP3 transmission: This sensor monitors the round trip, i.e. sending via SMTP and receiving via POP3
- DNS: This sensor monitors the DNS server on a system
- IP on DNS blacklist: This sensor monitors whether an IP is on one of the blacklists (e.g.: SpamCop). This can happen, for example, through spamming, or through hacked websites that are abused.
- SFTP Secure File Transfer Protocol: This sensor monitors the availability of the SFTP, i.e. FTP with SSL, server. This should be used instead of FTP, so that the access data is not transmitted in clear text. But I prefer SCP, a data connection through an SSH tunnel.
Further possibilities would be web-based administration consoles, for this purpose the HTTP sensors can be used. For databases this is a little bit more difficult, because for security reasons they are usually only accessible locally. The solution here is a script that is executed via SSH and returns appropriate values.

